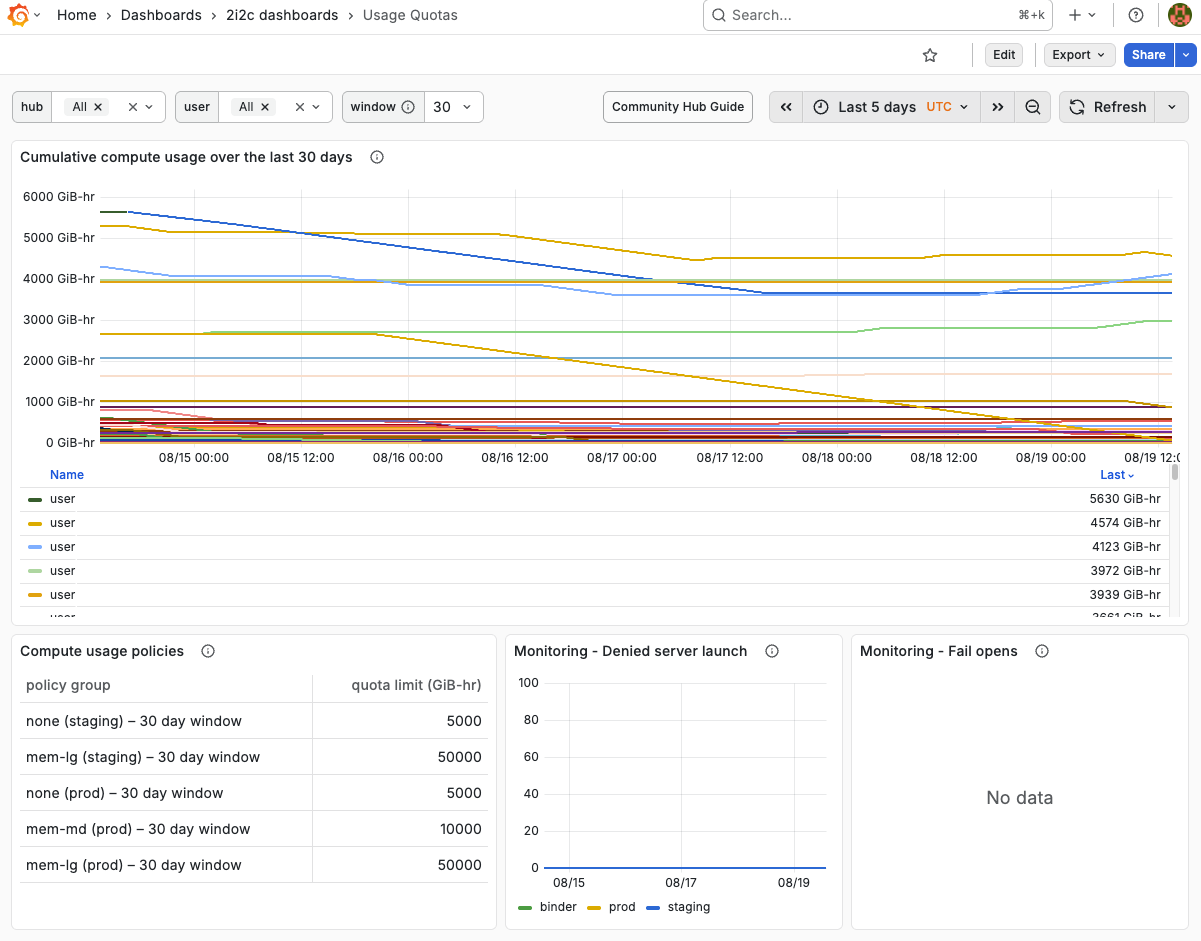
The “Usage Quotas” Grafana dashboard.
This dashboard consists of the following panels:
Cumulative compute usage over the last
$windowdays is a time series of the cumulative compute usage over the last$windowdaysCompute usage policies is a table of compute usage quota limits individually applied to policy group members
Monitoring - Denied server launch shows the number of server launches denied due to users exceeding compute quota limits
Monitoring - Fail opens shows when a user server is allowed to launch when the usage quota system is unavailable
with dropdowns to filter data by:
$hubto filter by hub name, e.g.staging,prod, etc.$userto filter by user name$windowto filter by the rolling window over which a compute policy is applied.